Calendars
This scenario presents how to define different kinds of calendars. These calendars can be applied to the specifications that take into account country-specific holidays and can be used for detecting and estimating the calendar effects.
The calendar effects are those parts of the movements in the time series that are caused by different number of weekdays in calendar months (or quarters). They arise as the number of occurrences of each day of the week in a month (or a quarter) differs from year to year. These differences cause regular effects in some series. In particular, such variation is caused by a leap year effect because of an extra day inserted into February every four years. As with seasonal effects, it is desirable to estimate and remove calendar effects from the time series.
The calendar effects can be divided into a mean effect, a seasonal part and a structural part. The mean effect is independent from the period and therefore should be allocated to the trend-cycle. The seasonal part arises from the properties of the calendar that recur each year. For one thing, the number of working days of months with 31 calendar days is on average larger than that of months with 30 calendar days. This effect is part of the seasonal pattern captured by the seasonal component (with the exception of leap year effects). The structural part of the calendar effect remains to be determined by the calendar adjustment. For example, the number of working days of the same month in different years varies from year to year.
Both X-12-ARIMA/X-13ARIMA-SEATS and TRAMO/SEATS estimate calendar effects by adding some regressors to the equation estimated in the pre-processing part (RegARIMA or TRAMO, respectively). Regressors mentioned above are generated from the default calendar or the user defined calendar.
The calendars of JDemetra+ simply correspond to the usual trading days contrast variables based on the Gregorian calendar, modified to take into account some specific holidays. Those holidays are handled as "Sundays" and the variables are properly adjusted to take into account the long term mean effects.
-
Calendars in JDemetra+ are stored in the Workspace window in the Utilities section. By default, JDemetra+ does not contain any county-specific national holidays. The only item available here is the Default calendar, which assumes that apart from each Saturday and Sunday no other days are non-working days. The Default calendar reflects only usual composition of the weeks in the calendar periods (months, quarters).
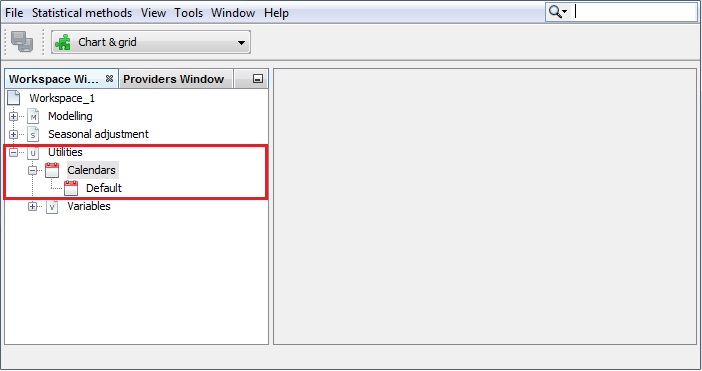
The Calendars section in the Workspace window
-
To study the default calendar double click on it. The details are displayed in three panels, which present the properties settings, the actual calendar variables and the spectral graph for the selected (by default – the first one) calendar variable. By default, the view shown in the picture below is displayed.
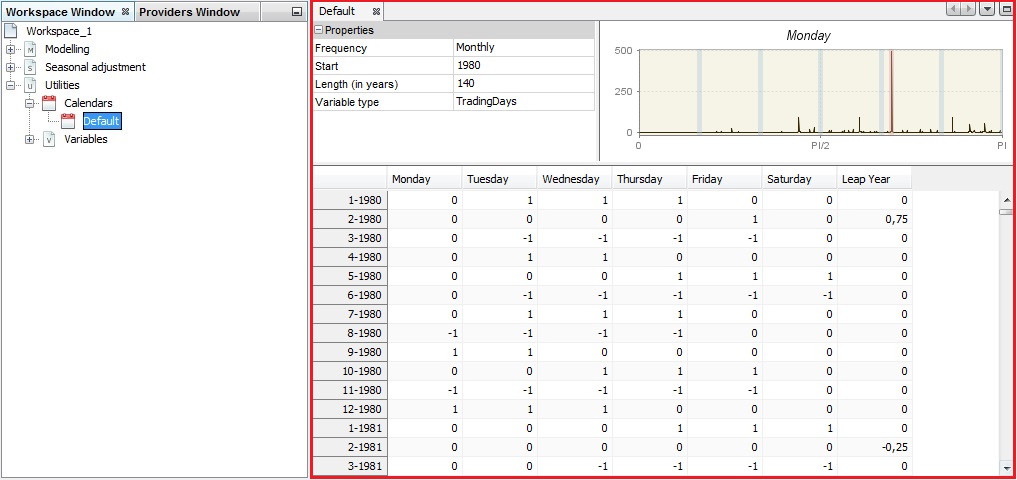
The default view of the default calendar
-
In the Properties panel the user can try different frequencies, variable type (trading days or working days1) and specify the variable span by defining the start date and a length of the series. The content of the other two panels will be adjusted automatically to these changes.
For the Trading days option seven regression variables are created. The usual trading days variables are defined by the following transformation: 6 contrast variables ($number\ of\ Mondays - number\ of\ Sundays$,…) are used with the length of periods that handle the leap year effect.
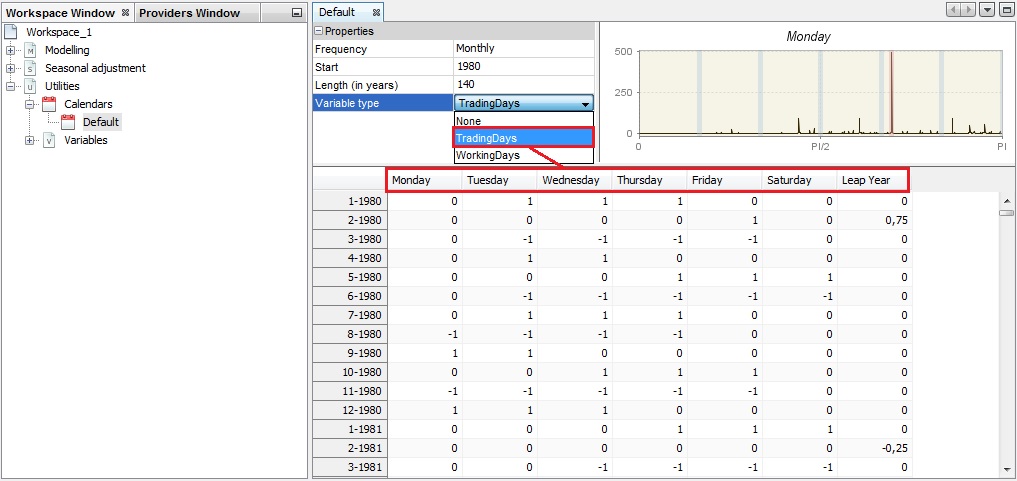
Modification of the initial settings for the Default calendar
-
For the usual working days variables two variables are used: one contrast variable and the length of periods.
The transformations used for creating the trading days variables and the working days variables have several advantages. They suppress from the contrast variables the mean and the seasonal effects, which are concentrated in the last variable. So, they lead to less correlated variables.
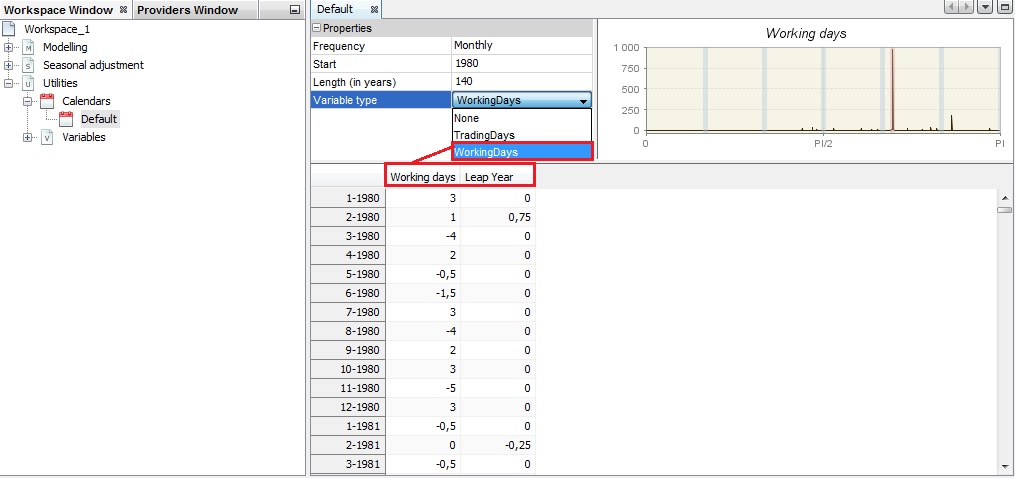
The working days variables in the Default calendar
-
The top-right panel displays the spectrum for the given calendar variable. By default, the first variable from the table is shown. To change it, click on the calendar variable header.
The spectrum presents the series in the frequency domain (X-axis). The peaks in the spectrum indicate the frequency of cyclical movements with periodicity less than two months, which are present in the time series. The periodicity of a phenomenon at frequency $f$ is $\frac{2\pi}{f}$. It means that for a monthly time series the seasonal frequencies are: $\frac{\pi}{6},\ \frac{\pi}{3},\ \frac{\pi}{2},\ \frac{2\pi}{3},\ \frac{5\pi}{6},\ \pi$ (which are equivalent to cycles per year i.e. in the case of a monthly series, the frequency $\frac{\pi}{3}$ corresponds to a periodicity of 6 months (2 cycles per year are completed)). For the quarterly series there are two seasonal frequencies: $\frac{\pi}{2}$ (one cycle per year) and $\pi$ (two cycles per year). A peak at the zero frequency always corresponds to the trend component of the series. The seasonal frequencies are marked as grey vertical lines, while violet lines represent the trading-days frequencies. The trading day frequency is 0.348 and derives from the fact that a daily component, which repeats every seven days, goes through 4.348 cycles in a month of an average length of 30.4375 days. It is therefore seen to advance 0.348 cycles per month when the data are obtained at twelve equally spaced times in 365.25 days (the average length of a year).
Calendar variables are not expected to have a peak neither at a zero frequency nor the seasonal frequencies. The presence and location of the peaks for the calendar variables should be checked when the user-defined calendar variables are considered.
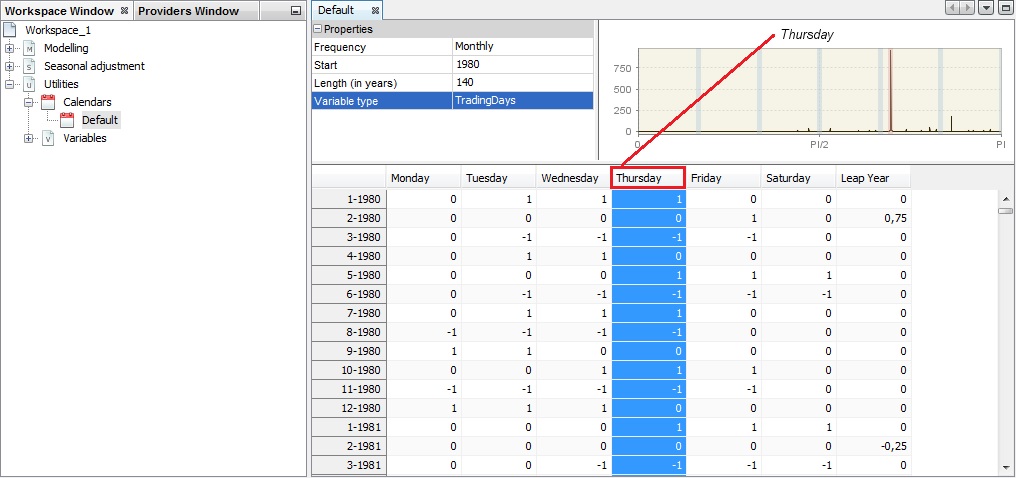
Spectrum for a trading days variable
-
Calendar variables can be copied/pasted to an Excel file. To do it, open an Excel file and click on the top-left cell in the panel on the left and drag and drop the series to the Excel file.
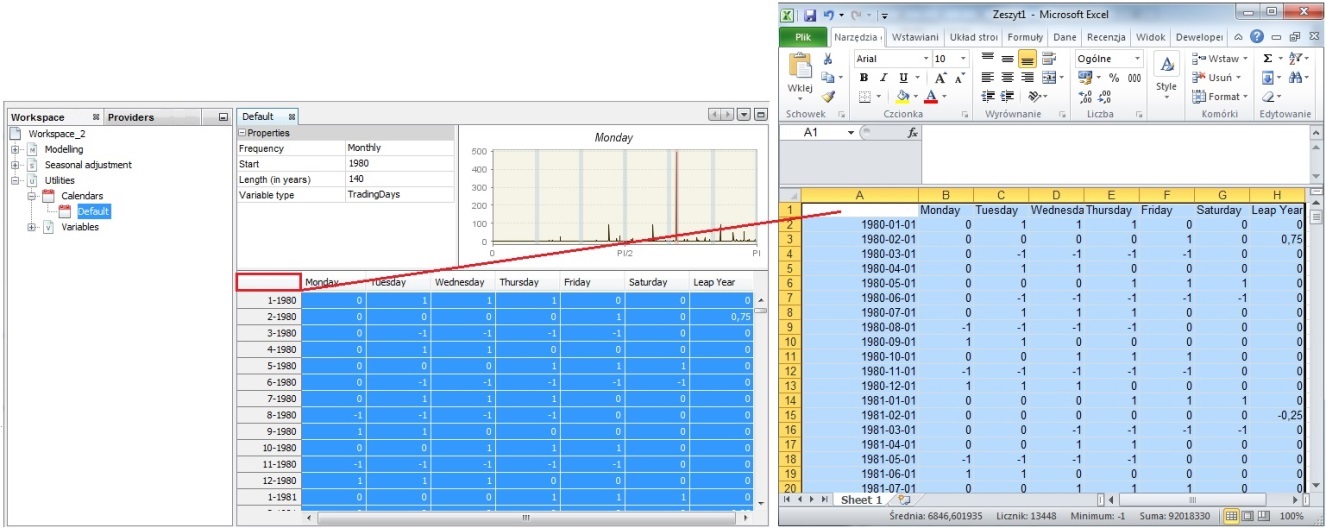
Copying the calendar variables by drag & drop
-
A new calendar can be created through the user interface. This is a long process that will be described in the next three scenarios. Another option to create a calendar is by importing the existing file to JDemetra+. To do it, right click on the Calendar item from the Workspace window and choose the Import item from the menu.
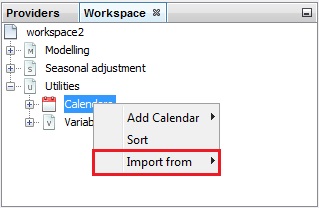
Importing a calendar to JDemetra+
-
The example of the file containing a calendar is presented below.
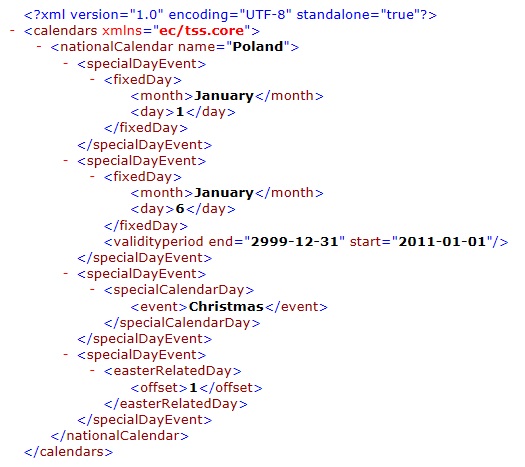
An example of the Calendars file.
-
To import the file containing the calendar choose the appropriate file and open it.
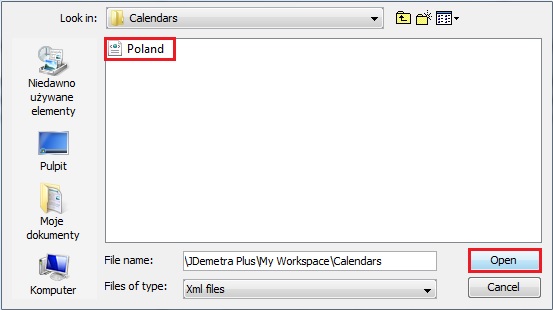
Choosing the file
-
JDemetra+ adds the calendar to the list.
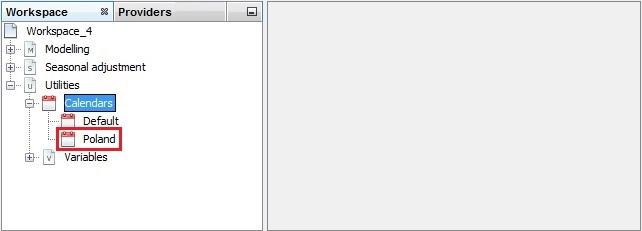
A list of calendars with a newly imported calendar
-
To change the existing calendar click the option Edit from the context menu, as it has been shown above. JDemetra+ displays the list of the holidays that have been defined for this calendar.
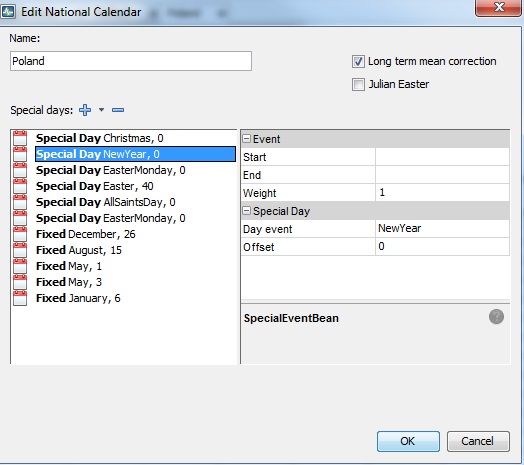
Edit a calendar window
-
To add a holiday to the calendar unfold the "+" menu. To remove a holiday from the list click on it and choose the "-" button. To remove the existing holiday from the list, click on it and press the "-" button. Once all changes are introduced, click OK. More details the user can find in the National calendars case study.
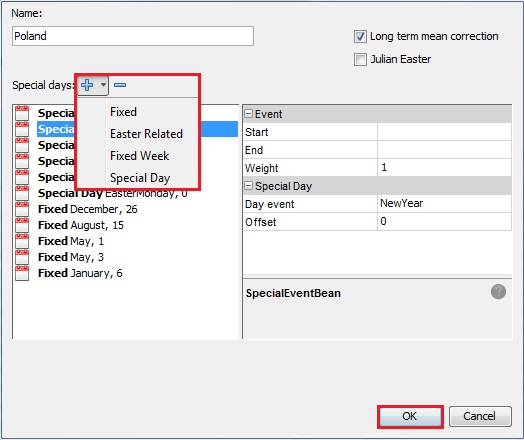
Removing a holiday from the calendar
-
To adjust the series for the country-specific calendar effects, the appropriate calendar needs to be created. To do it, right click on the Calendar item from the Workspace window and choose the Add Calendar item from the menu.
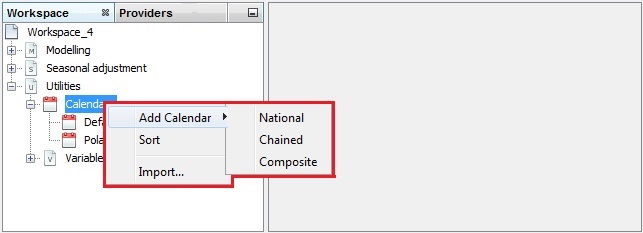
Adding a calendar
Three options are available here:
-
National calendars, which is appropriate to define a calendar that includes country-specific holidays;
-
Composite calendars, which is an option designed for the seasonal adjustment of an aggregated time series that is composed of national data. It enables the user to create a calendar that is the weighted sum of several national calendars.
-
Chained calendars, defined by two national calendars and a break date.
These options are considered in the separate sub-scenarios. Study the ones that match your needs.
-
-
Trading Days – seven regression variables, which correspond to differences in economic activity between all days of the week and a leap year effect; Working Days – two regression variables, which correspond to differences in economic activity between the working days (Monday to Friday) and the non-working days (Saturday - Sunday) and a leap year effect. ↩